Planning
With Cannavigia's planning tool, you can easily visualize and manage the timelines of your cultivation batches and projects. By accessing planning diagrams and calendars, and utilizing hover functionality for phase details, you can effectively plan and coordinate your cultivation activities for optimal results.
Planning Dashboard View
Summary
Under Cultivation>Planning you can see the planning diagrams and calendars of all ongoing projects.
Summary boxes with Info and Values listed below as they appear from left to right:
- Planned Batches
- Immature Batches
- Vegetative Batches
- Flowering Batches
- Batches to Harvest
- Completed Batches

Filters
Below the Summary there are Filter boxes and their options on the dashboard view, also appearing from left to right:
-
Grouping (Single selection only)
-
- Area
- Projects
- Cultivar
-
Area Filter (Multiple selection available for Areas listed)

-
Project (Multiple selection available for Projects listed)

-
Current Phase Filter (Single selection only)

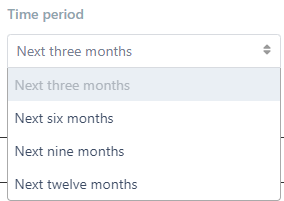
- Time period (Single selection only)
After selecting and clicking on Apply Filters, Gantt chart is presented below with applied filters.

Phase Bar
On the plant batch and planning pages, you’ll see two phase bars that help you compare the actual and planned timelines for each cultivation phase:
Top Bar (Big Bar / Series 1):
Purpose: Displays the actual start and end dates of current and past plant phases, along with estimates for upcoming phases.
Details: This bar provides the current status of your plant batch, showing when each phase actually began and ended.
By hovering your mouse over each phase, on the top bar, you can see the estimated start date and end date of that phase.

Bottom Bar (Small Bar / Series 2):
Purpose: Displays the planned phases based on cultivar information.
Details: This bar reflects the initial schedule and planned timeline for each phase, allowing you to compare planned versus actual progress.
When you hover your mouse over each phase on the bottom bar, the scheduled start and end dates for that phase will be displayed.
